


Florida Today: Paying for college? Here’s what students should know upfront
Sun-Sentinel: On Hope Florida grand jury, let the light in | Editorial
Sun-Sentinel: Be sensible: Keep mandatory child vaccines | Editorial
Sun-Sentinel: Lift the secrecy on Palm Beach data center | Editorial
Sun-Sentinel: A judge pays a high price for 'gross negligence' | Editorial
Sun-Sentinel: In Hollywood, a hasty but wise exit | Editorial
Sun-Sentinel: Two lawyers, the Bar, and a gross injustice | Editorial
Sun-Sentinel: Trump's impulsive act of warmongering | Editorial
Sun-Sentinel: A race against time on AIDS medications | Editorial
Sun-Sentinel: The sheer tackiness of Trump Airport | Editorial

Sayfie Review Featured Column
Part 2: Is the Florida legislature a body of citizen legislators or experienced politicians after 20 years of term limits?
By Kathryn DePalo-Gould, PhD, Florida International University
And Alexander Anacki, BA, Florida International University
Overview
In 1992, Florida voters overwhelmingly supported the enactment of term limits
The dataset includes all House and Senate members elected at the time of the general election from 1990 through 2020. We compare legislators with previous elective experience pre- and post-term limits. We also assess any differences by political party. Lastly, we look at what kind of previous elective offices these House and Senate members held.
Results
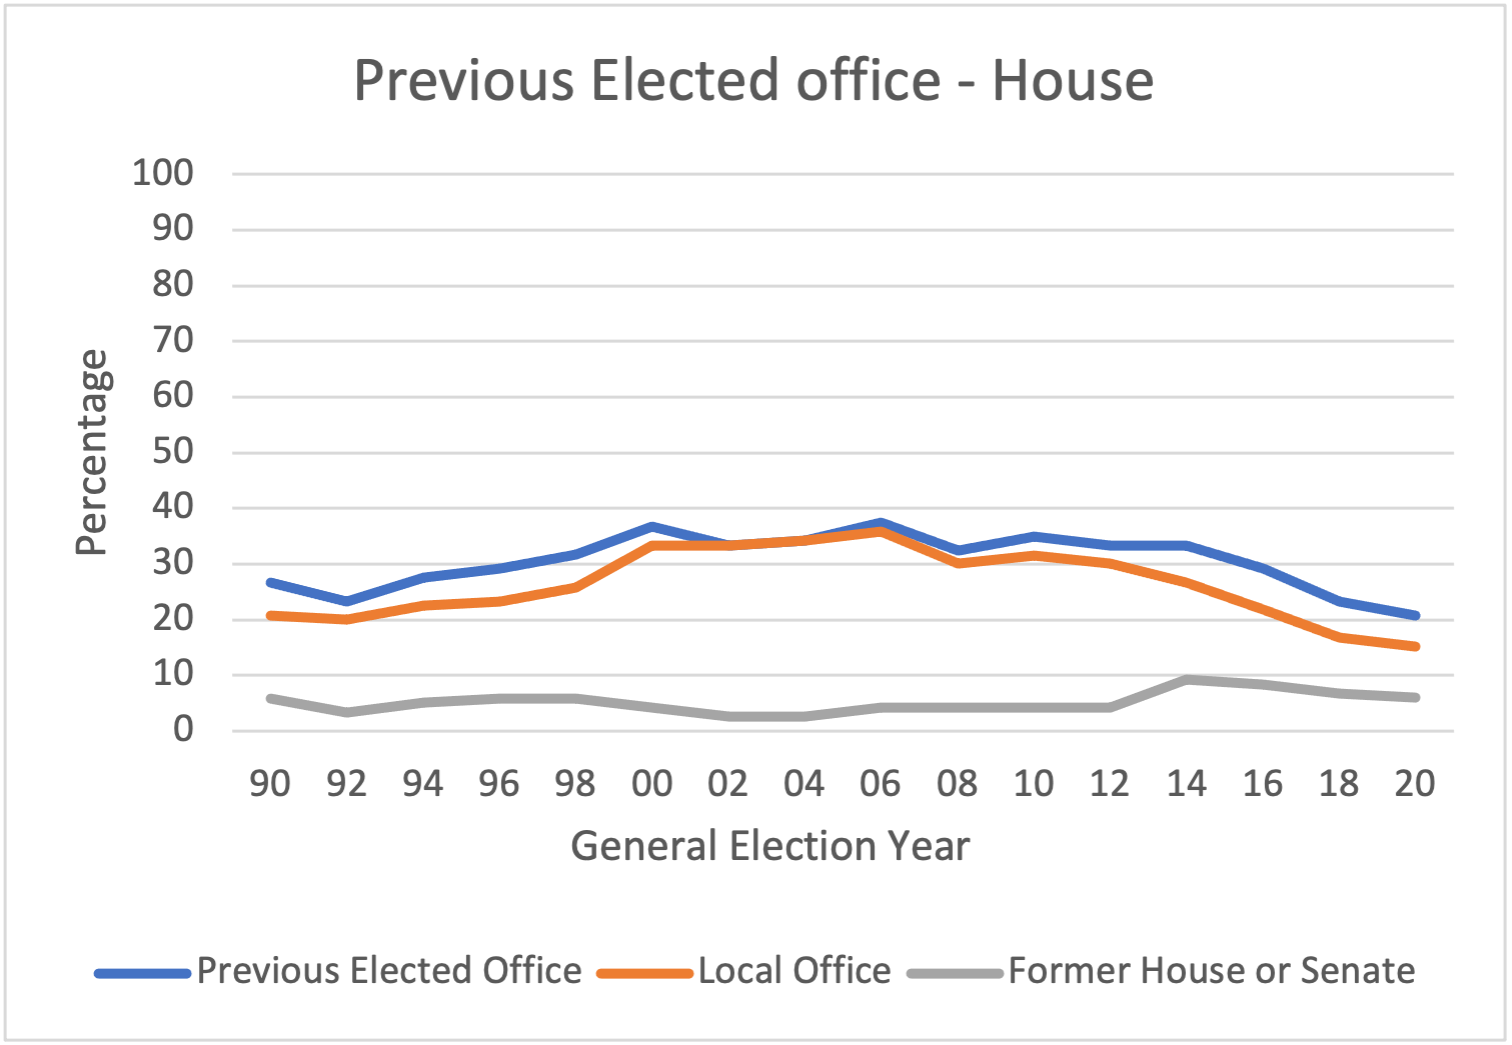

Figure 1: Previous Elective Experience, House and Senate, 1990-2020.
Note: The Senate data are statistically significant at the .002 level.
According to Figure 1, following the introduction of term limits in Florida, the proportion of legislators in the House with previous elected experience increased slightly while the proportion of legislators in the Senate with previous elected experience increased dramatically. In both chambers, previous elected experience has steadily declined since 2014, although there was an uptick in the Senate with the 2020 election.
In the House, members with previous elected experience peaked at 37.5% in 2006. In the Senate, this peaked at 95% in 2010. The pipeline between the two chambers has become more noticeable following the onset of term limits. In 2000, 60% of Senate members were former House members. In 2020, two decades after term limits, 77.5% of Senate members were former House members. The median for these two decades is also 77.5%.
In years where the proportion of former House members in the Senate increased, the proportion of members who had previously served in local office decreased. In the House, there is a much more limited set of former House or Senate members serving in office, though their ranks have expanded in recent years. Largely, the long-term changes in previous elected experience in the House seem immune to the influence of term limits. Instead of allowing a new class of “citizen legislators” to take office, the introduction of term limits led to an experience-driven Senate and a fairly-unchanged House.


Figure 2: Previous Elective Experience by Party, House and Senate, 1990-2020.
Note: The Republican data are statistically significant in both chambers at the .05 level for the House and the .000 level in the Senate.
According to Figure 2, in recent years, in both the House and Senate, the proportion of members with previous elected experience has declined. Historically, Democrats in the House have had more previous elected experience than Republicans; this was the case between 1990 and 2000, as well as between 2008 and 2020. Since 2014, the number of Republicans with previous elected experience serving in the House has dramatically declined, reaching a low of 14.1% in 2020. This level is even lower than the pre-term limits era. In the Senate, this decline in Republicans with previous elected experience between 2014 and 2020 also holds true; though, excluding 1994 to 2000, Republicans have had more previous elected experience than Democrats. This is still more than three-quarters of the Democratic and Republican caucuses in the Senate, 75% and 79.2%, respectively.
Table 1: Previous Elected Experience- House
|
Election Year |
City |
County |
School Board/ Superinten. |
Special District |
Judge |
Multiple Local |
Previous Legislature |
Previous Legislature and Local |
Total N |
|
1990 |
56.3% |
15.6% |
0.0% |
3.1% |
0.0% |
3.1% |
21.9% |
0.0% |
32
|
|
1992 |
60.7% |
14.3% |
7.1% |
3.6% |
0.0% |
0.0% |
14.3% |
0.0% |
28
|
|
1994 |
60.6% |
9.1% |
9.1% |
3.0% |
0.0% |
0.0% |
18.2% |
0.0% |
33
|
|
1996 |
57.1% |
5.7% |
11.4% |
2.9% |
0.0% |
2.9% |
20.0% |
0.0% |
35
|
|
1998 |
55.3% |
7.9% |
13.2% |
2.6% |
0.0% |
2.6% |
18.4% |
0.0% |
38
|
|
2000 |
65.9% |
4.5% |
15.9% |
0.0% |
0.0% |
2.3% |
9.1% |
2.3% |
44
|
|
% Change 1990-2000
|
+9.6 |
-11.1 |
+15.9 |
-3.1 |
0 |
-0.8 |
-12.8 |
+2.3 |
|
|
2002 |
62.5% |
12.5% |
15.0% |
0.0% |
0.0% |
2.5% |
0.0% |
7.5% |
40
|
|
2004 |
58.5% |
17.1% |
12.2% |
4.9% |
0.0% |
0.0% |
0.0% |
7.3% |
41
|
|
2006 |
64.4% |
11.1% |
8.9% |
4.4% |
0.0% |
0.0% |
4.4% |
6.7% |
45
|
|
2008 |
66.7% |
7.7% |
7.7% |
5.1% |
0.0% |
0.0% |
7.7% |
5.1% |
39
|
|
2010 |
69.0% |
2.4% |
9.5% |
7.1% |
0.0% |
0.0% |
9.5% |
2.4% |
42
|
|
% Change 2000-2010
|
+3.1 |
-2.1 |
-6.4 |
+7.1 |
0 |
-2.3 |
+0.4 |
+0.1 |
|
|
2012 |
57.5% |
5.0% |
10.0% |
10.0% |
0.0% |
5.0% |
10.0% |
2.5% |
40
|
|
2014 |
42.5% |
7.5% |
7.5% |
10.0% |
0.0% |
5.0% |
20.0% |
7.5% |
40
|
|
2016 |
37.1% |
14.3% |
2.9% |
8.6% |
0.0% |
5.7% |
22.9% |
8.6% |
35
|
|
2018 |
35.7% |
17.9% |
3.6% |
3.6% |
0.0% |
7.1% |
25.0% |
7.1% |
28
|
|
2020 |
32.0% |
16.0% |
4.0% |
4.0% |
4.0% |
8.0% |
24.0% |
8.0% |
25
|
|
% Change 2010-2020
|
-37.0 |
+13.6 |
-5.5% |
-3.1 |
+4.0 |
+8.0 |
+14.5 |
+5.6 |
|
*Sig. at .10
Table 1 highlights the type of elective experience of House members. There are statistically significant differences in the kind of previous office held between 1990-2020. As a percentage change, by 2000 when term limits took effect, city and school board/superintendent experience was more prevalent than county (commission, constitutional: Supervisor of Elections, Tax Collector, etc.) and previous legislative experience. However, that fluctuated again by 2010, just a decade after term limits kicked in. While county experience continued to decline, those entering with city government and special district experience increased. By 2020, holding only city office was much less important than county and previous legislative experience.
Table 2: Previous Elected Experience- Senate
|
Election Year |
City |
County |
School Board/ Superintendent |
Multiple Local |
Previous Legislature |
Previous Legislature and Local |
Total N |
|
1990 |
6.7% |
6.7% |
0.0% |
3.3% |
66.7% |
16.7% |
30
|
|
1992 |
3.8% |
11.5% |
7.7% |
3.8% |
57.7% |
15.4% |
26
|
|
1994 |
4.3% |
13.0% |
8.7% |
4.3% |
56.5% |
13.0% |
23
|
|
1996 |
8.7% |
13.0% |
8.7% |
4.3% |
56.5% |
8.7% |
23
|
|
1998 |
4.0% |
4.0% |
4.0% |
8.0% |
72.0% |
8.0% |
25
|
|
2000 |
3.4% |
6.9% |
3.4% |
3.4% |
69.0% |
13.8% |
29
|
|
% Change 1990-2000
|
-3.3 |
+0.2 |
+3.4 |
+0.1 |
+2.3 |
-2.9 |
|
|
2002 |
2.7% |
2.7% |
2.7% |
2.7% |
67.6% |
21.6% |
37
|
|
2004 |
2.7% |
2.7% |
0.0% |
2.7% |
73.0% |
18.9% |
37
|
|
2006 |
0.0% |
5.4% |
0.0% |
2.7% |
75.7% |
16.2% |
37
|
|
2008 |
0.0% |
5.4% |
0.0% |
2.7% |
70.3% |
21.6% |
37
|
|
2010 |
2.6% |
10.5% |
0.0% |
2.6% |
63.2% |
21.1% |
38
|
|
% Change 2000-2010
|
-0.8 |
+3.6 |
-3.4 |
-0.8 |
-5.8 |
+7.3 |
|
|
2012 |
2.7% |
5.4% |
0.0% |
2.7% |
62.2% |
27.0% |
37
|
|
2014 |
2.7% |
5.4% |
0.0% |
2.7% |
62.2% |
27.0% |
37
|
|
2016 |
2.9% |
2.9% |
0.0% |
0.0% |
74.3% |
20.0% |
35
|
|
2018 |
3.1% |
3.1% |
0.0% |
0.0% |
75.0% |
18.8% |
32
|
|
2020 |
0.0% |
0.0% |
0.0% |
0.0% |
71.0% |
29.0% |
31
|
|
% Change 2010-2020
|
-2.6 |
-10.5 |
0 |
-2.6 |
+7.8 |
+2.0 |
|
In Table 2, we find no statistically significant differences among Senators by type of previous elective experience. Most who entered the state Senate prior to term limits have previous experience in the Legislature, particularly from the House. By 2020, those with any previous elective experience came from the legislature in all cases, with 29% who also had local government experience.
Conclusion
While an intention of term limits was to curtail the amount of career legislators, legislators are continuing to enter the Legislature with experience in elected office. Term limits led to a modest increase in local officeholders serving in the House, though these gains declined starting in 2006. In the Senate, the percentage of members with local government experience is similar to that in the House. Unlike the House, however, the percentage of members with prior experience in the Senate is high, with most of those members having served in the House. This gives the Senate a legislative upper hand — one which was always present, albeit to a lesser extent prior to term limits — as its members have more experience navigating Tallahassee politics.
